Status and Outcomes By Category
Displays an overview of the Count of Interventions by Category. There are two different measures to further analyze the count of interventions by category: Interventions by Status and Category, and Closed Interventions by Outcome and Category. These can be viewed by clicking the tab headers at the top of the report.
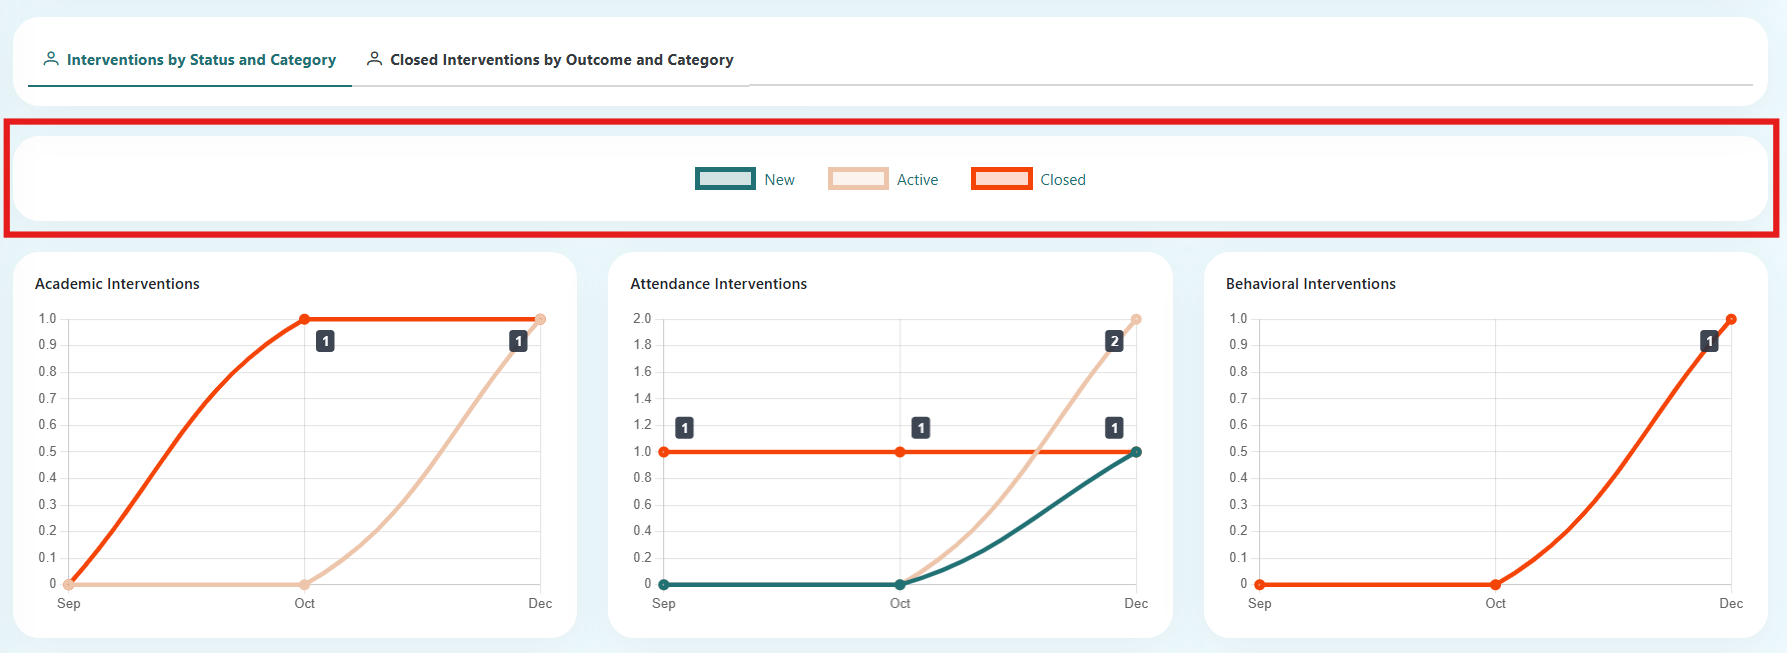
A master legend is displayed below the report tab headings. Legend items may be toggled to focus data points into the chart view. For more information on this, please visit the portal charts documentation.
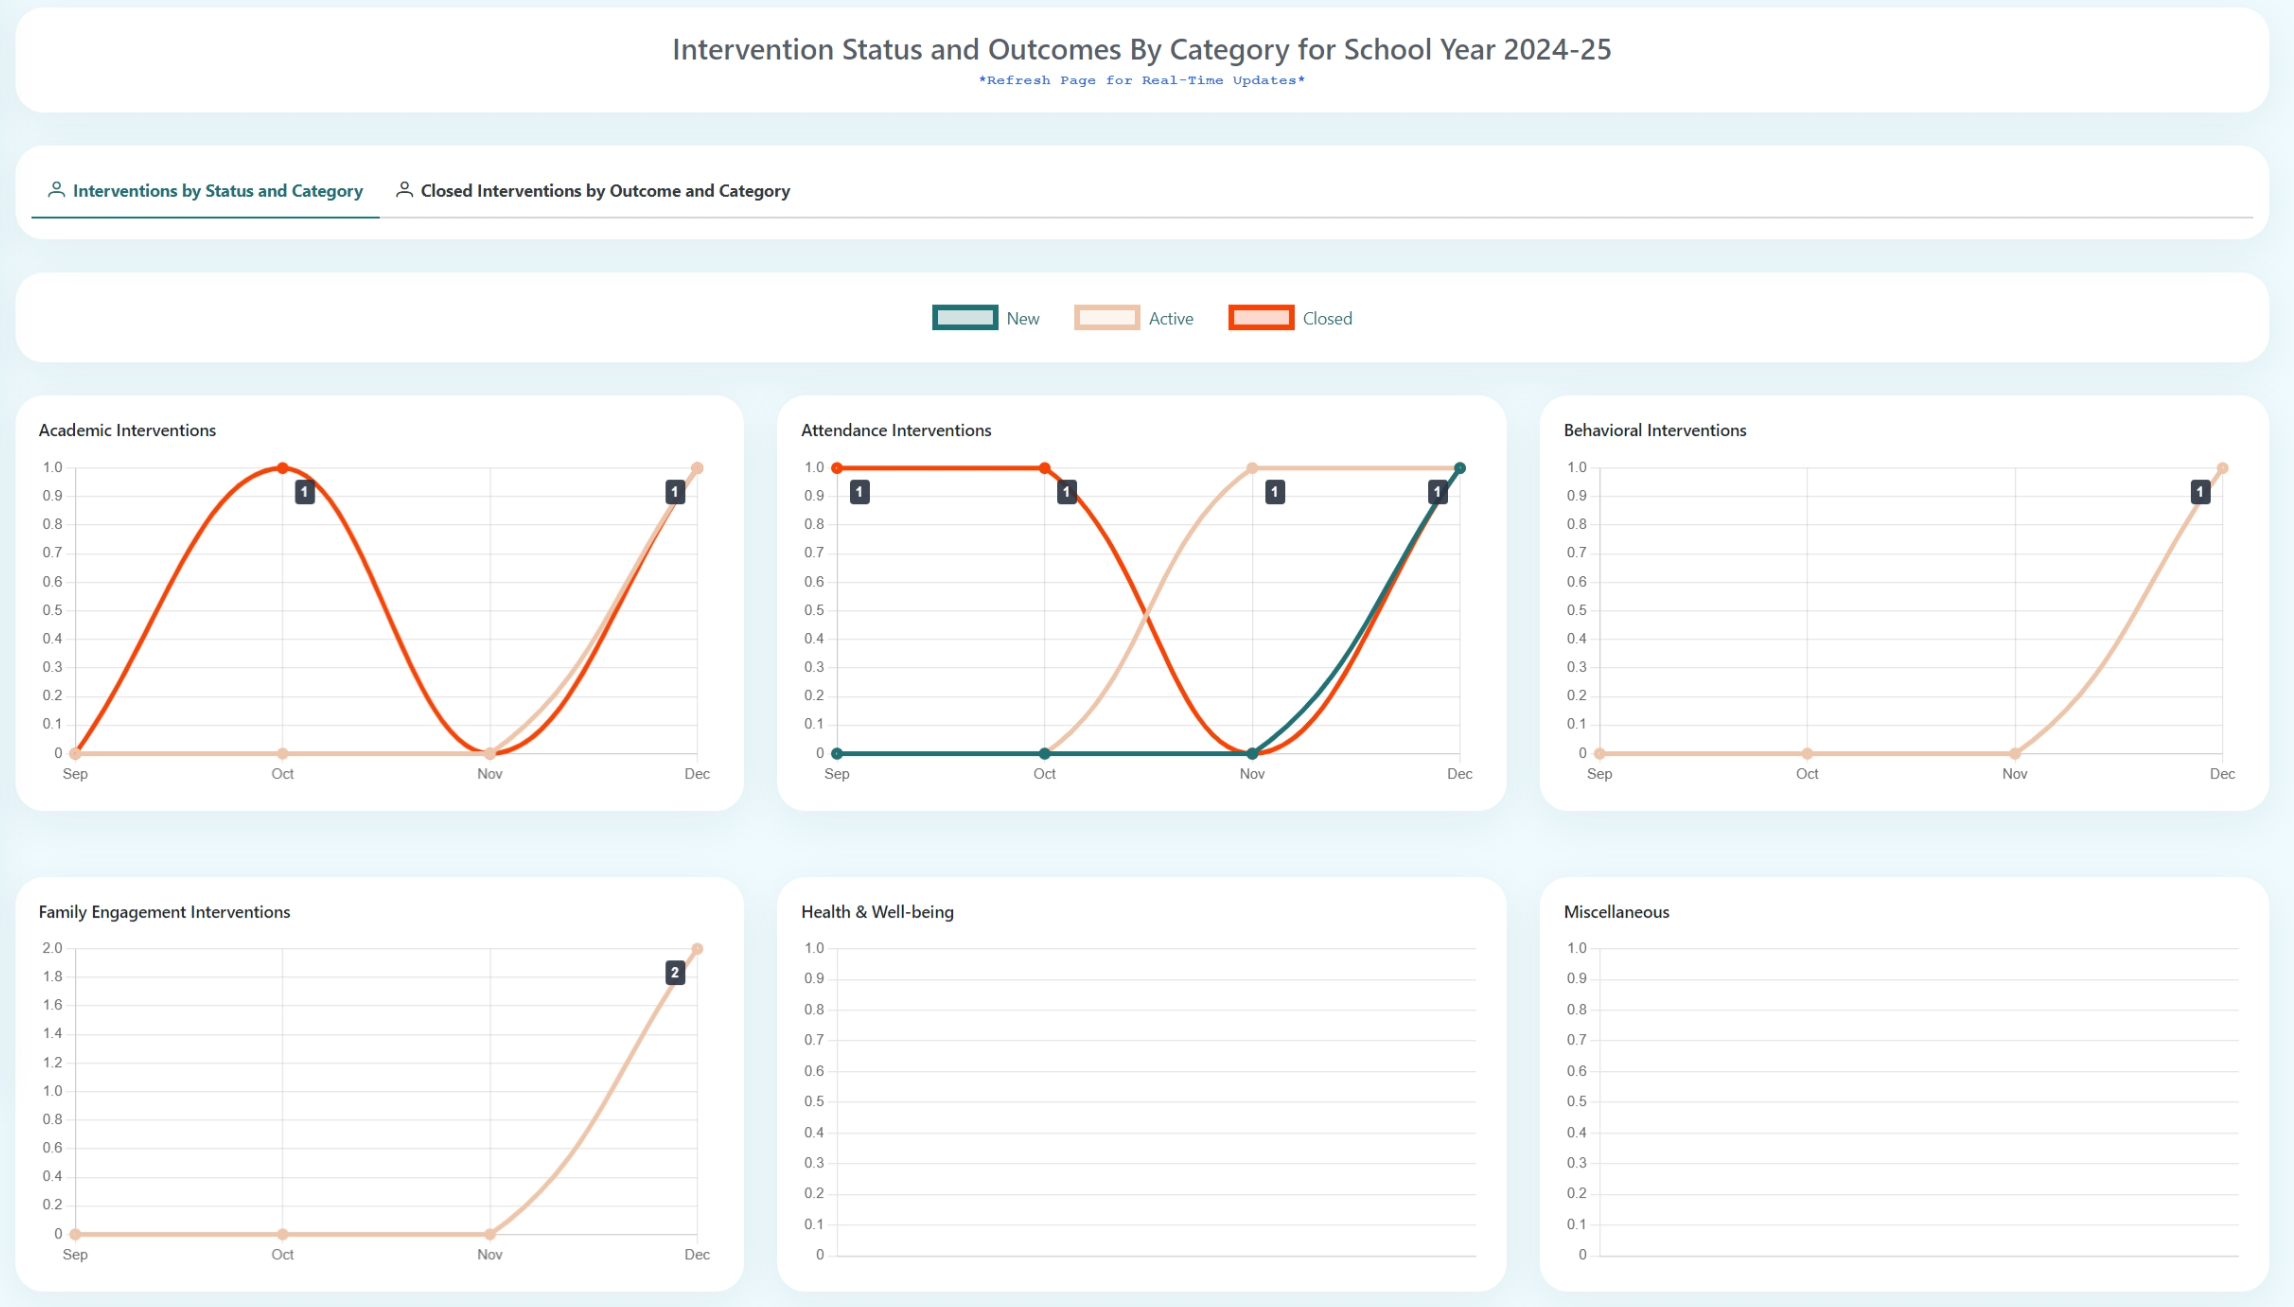
Interventions by Status and Category
This tab view will display a line chart for each Intervention Category with the Count of Interventions by status (new, active, and closed).
If there were no interventions created for the category, the chart will be empty. However, if there are any interventions, the month axis will begin at the start of the first entry of any intervention regardless of category. This will make all charts display the same time frame.
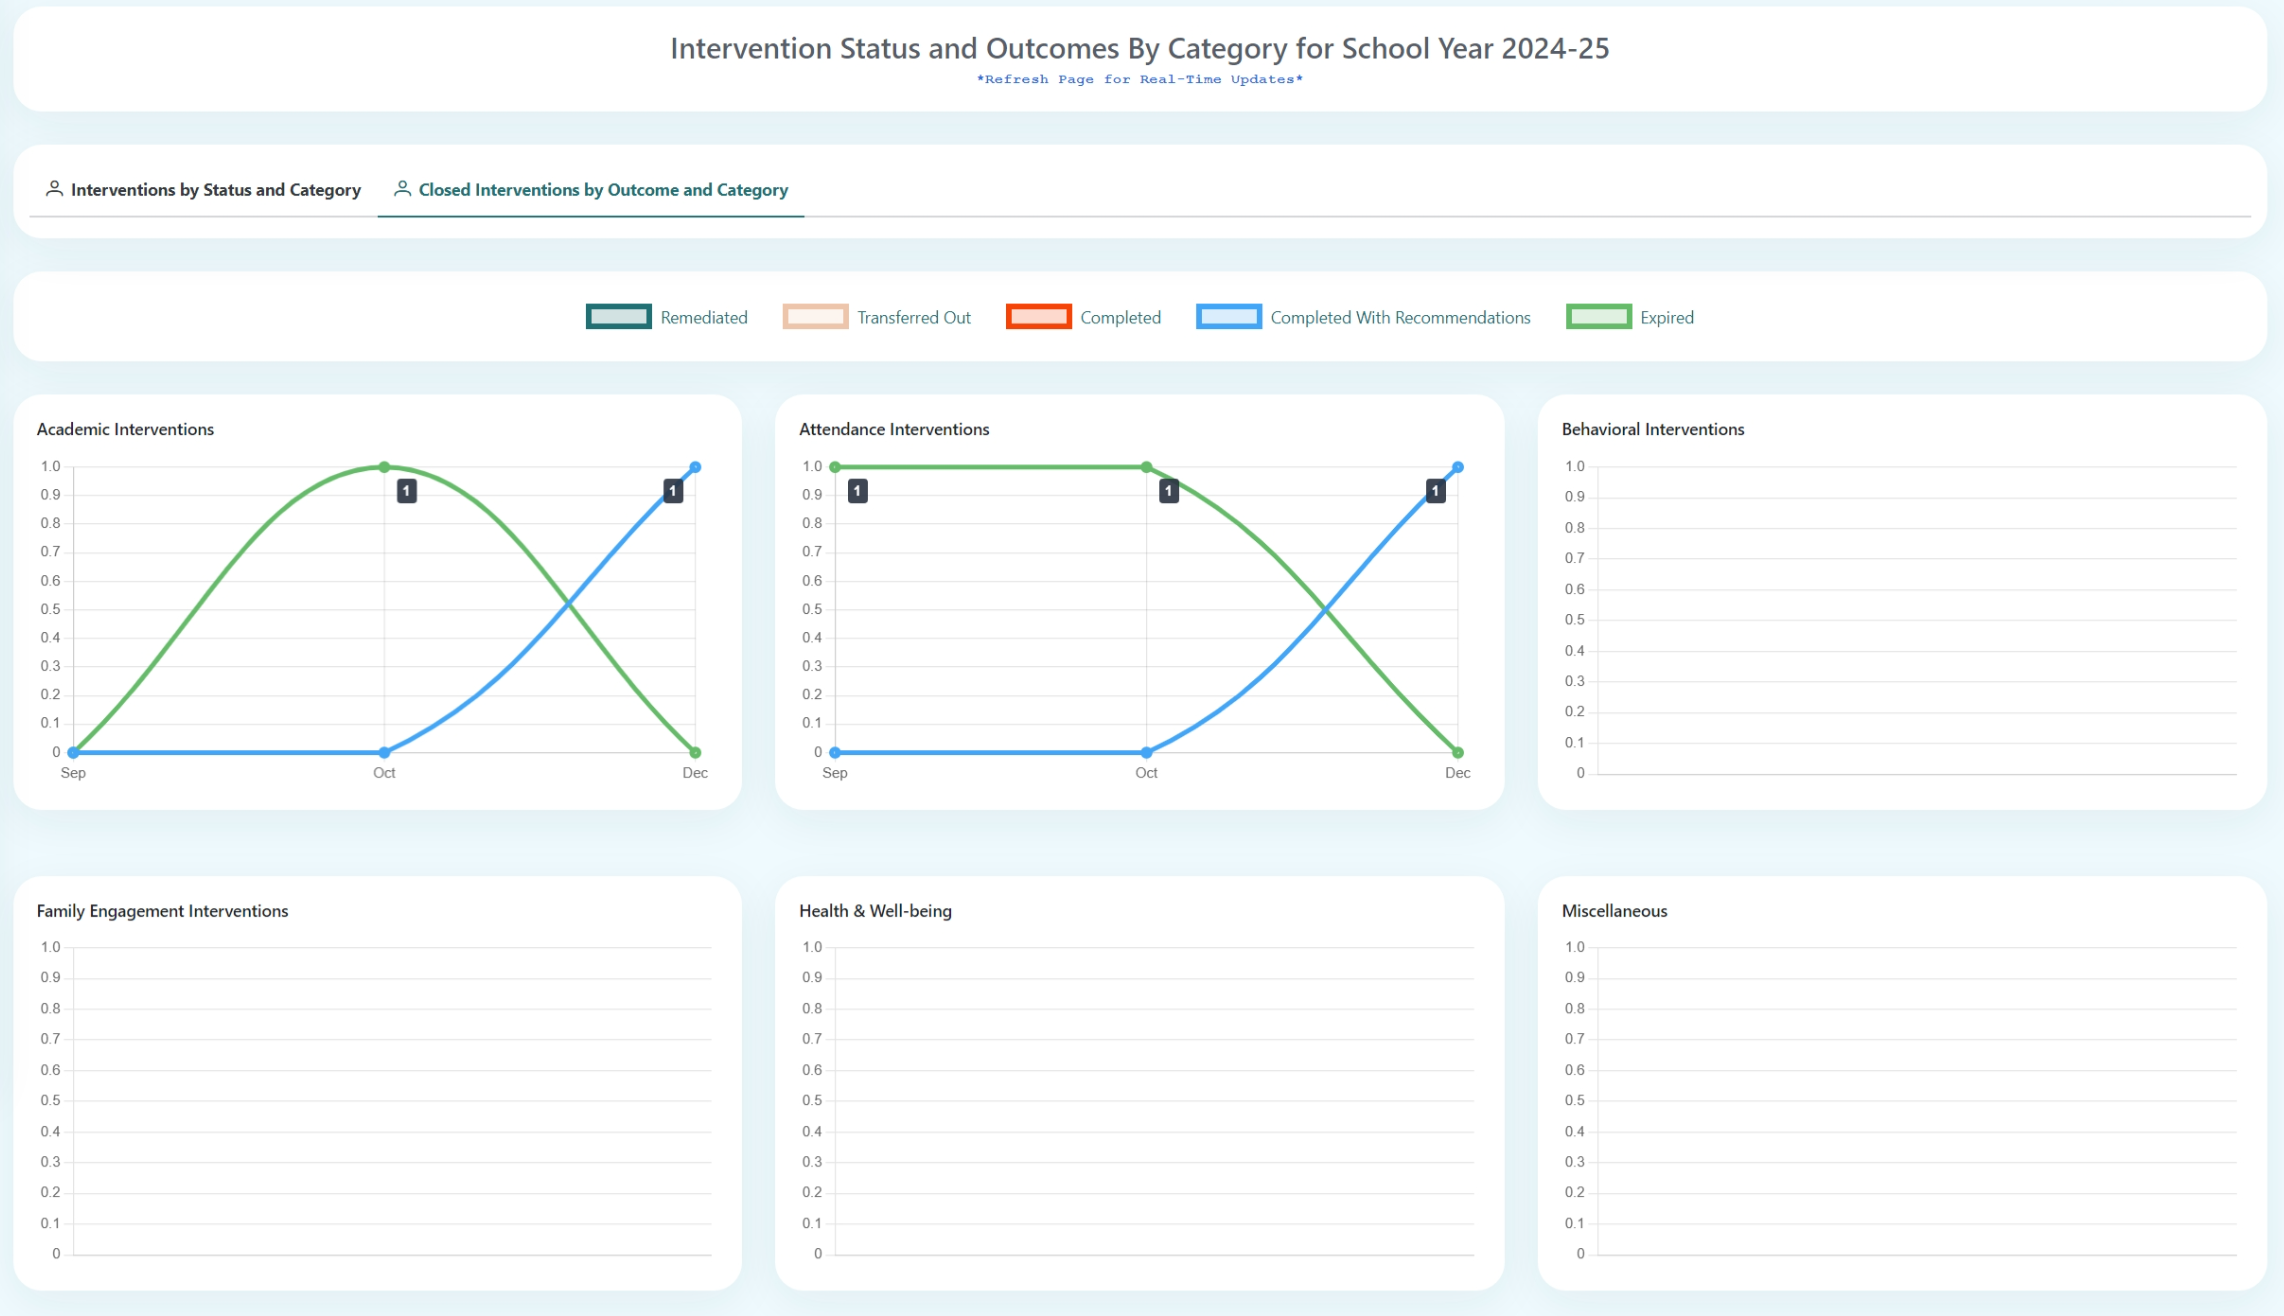
Closed Interventions by Outcome and Category
This tab view will display a line chart for each Intervention Category with the Count of Interventions outcome (Remediated, Transferred Out, Completed, Completed With Recommendations, and Expired).
If there were no interventions created for the category, the chart will be empty. However, if there are any interventions, the month axis will begin at the start of the first entry of any intervention regardless of category. This will make all charts display the same time frame.
Notice how only categories with closed interventions will have data points on the Closed Interventions by Outcome and Category tab