Intervention Activity Reports
Displays a break down of Interventions by Status and Interventions by Student for the current school year using three views: Intervention Status Monthly Breakdown, Intervention Status Summary, and Active and Closed Interventions.
Intervention Breakdown
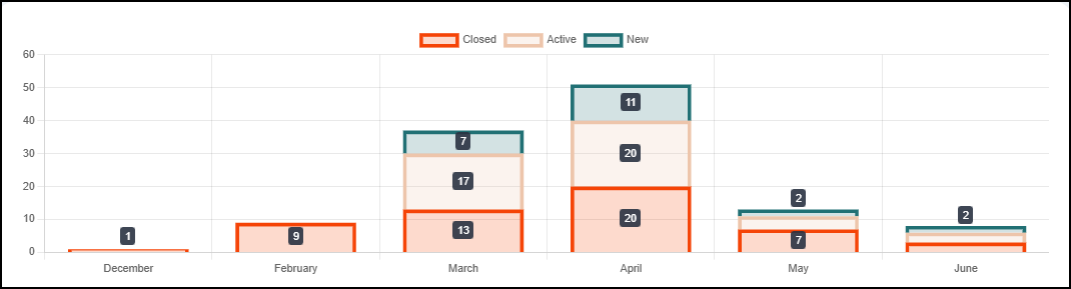
The Intervention Breakdown Report displays a running count of interventions by status (New, Active, Closed) for each month using a stacked bar chart. Interventions in New and Active statuses carry over into subsequent months as long as they remain open, providing a continuous view of ongoing activity. Closed interventions are counted only in the month they are closed and do not carry forward. This report helps visualize how interventions progress and accumulate over time throughout the school year.
Intervention Summary
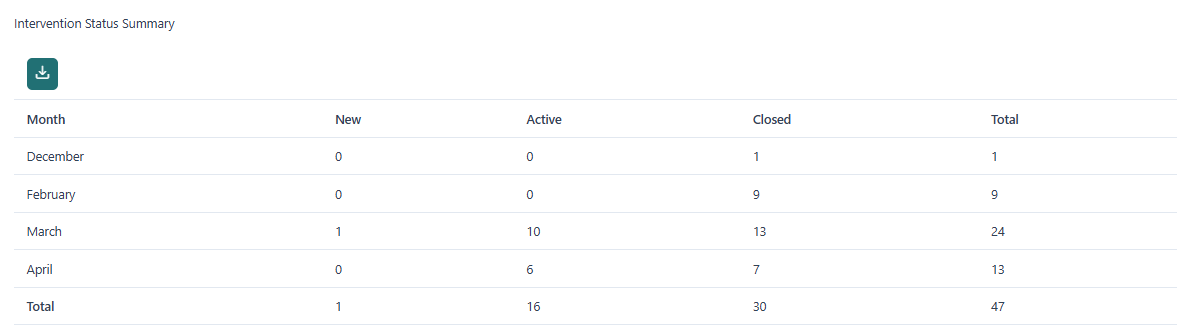
The Intervention Summary Table displays a distinct count of interventions by status for each month. Each status (New, Active, Closed) is counted only once in the month in which it occurs and does not carry over into subsequent months. This allows for a clear view of when status changes happen over time. Monthly totals are also aggregated into a year-to-date total, providing an overall summary of intervention activity for the selected school year.
Active and Closed Interventions by Student
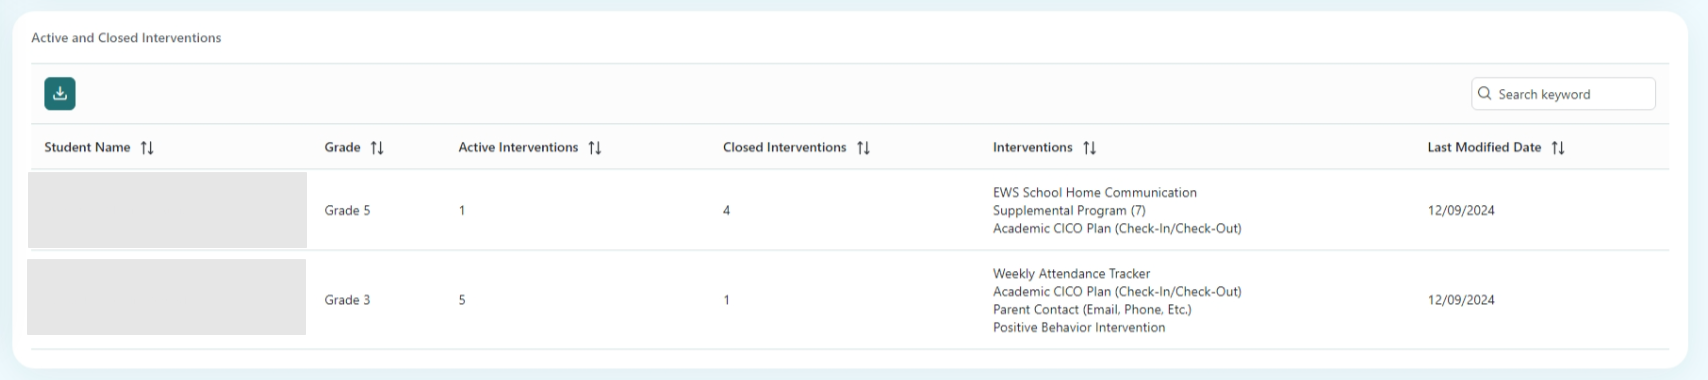
Displays a table with the count of Active and Closed Status interventions by student within the current school year. The table may be searched by entering a keyword into the search box. The keyword applies to the Student Name, Grade, and Interventions columns in the table and will filter as you type into the box. A CSV version of this table is downloadable by clicking the download button .