School Dashboard
The school dashboard provides a high-level perspective of EWS indicators organized for viewing and analysis by school personnel for a single school only.
Visuals
The visuals displayed on this dashboard includes:
| Visual | Description |
|---|---|
| Risk Level Student Count Cards | Displays the count of students and the business rule for each risk level |
| Students By Grade Level | A line graph that shows the count of students by risk level by grade |
| Students By Risk Indicator | A bar graph that shows the count of students by risk level by risk indicator |
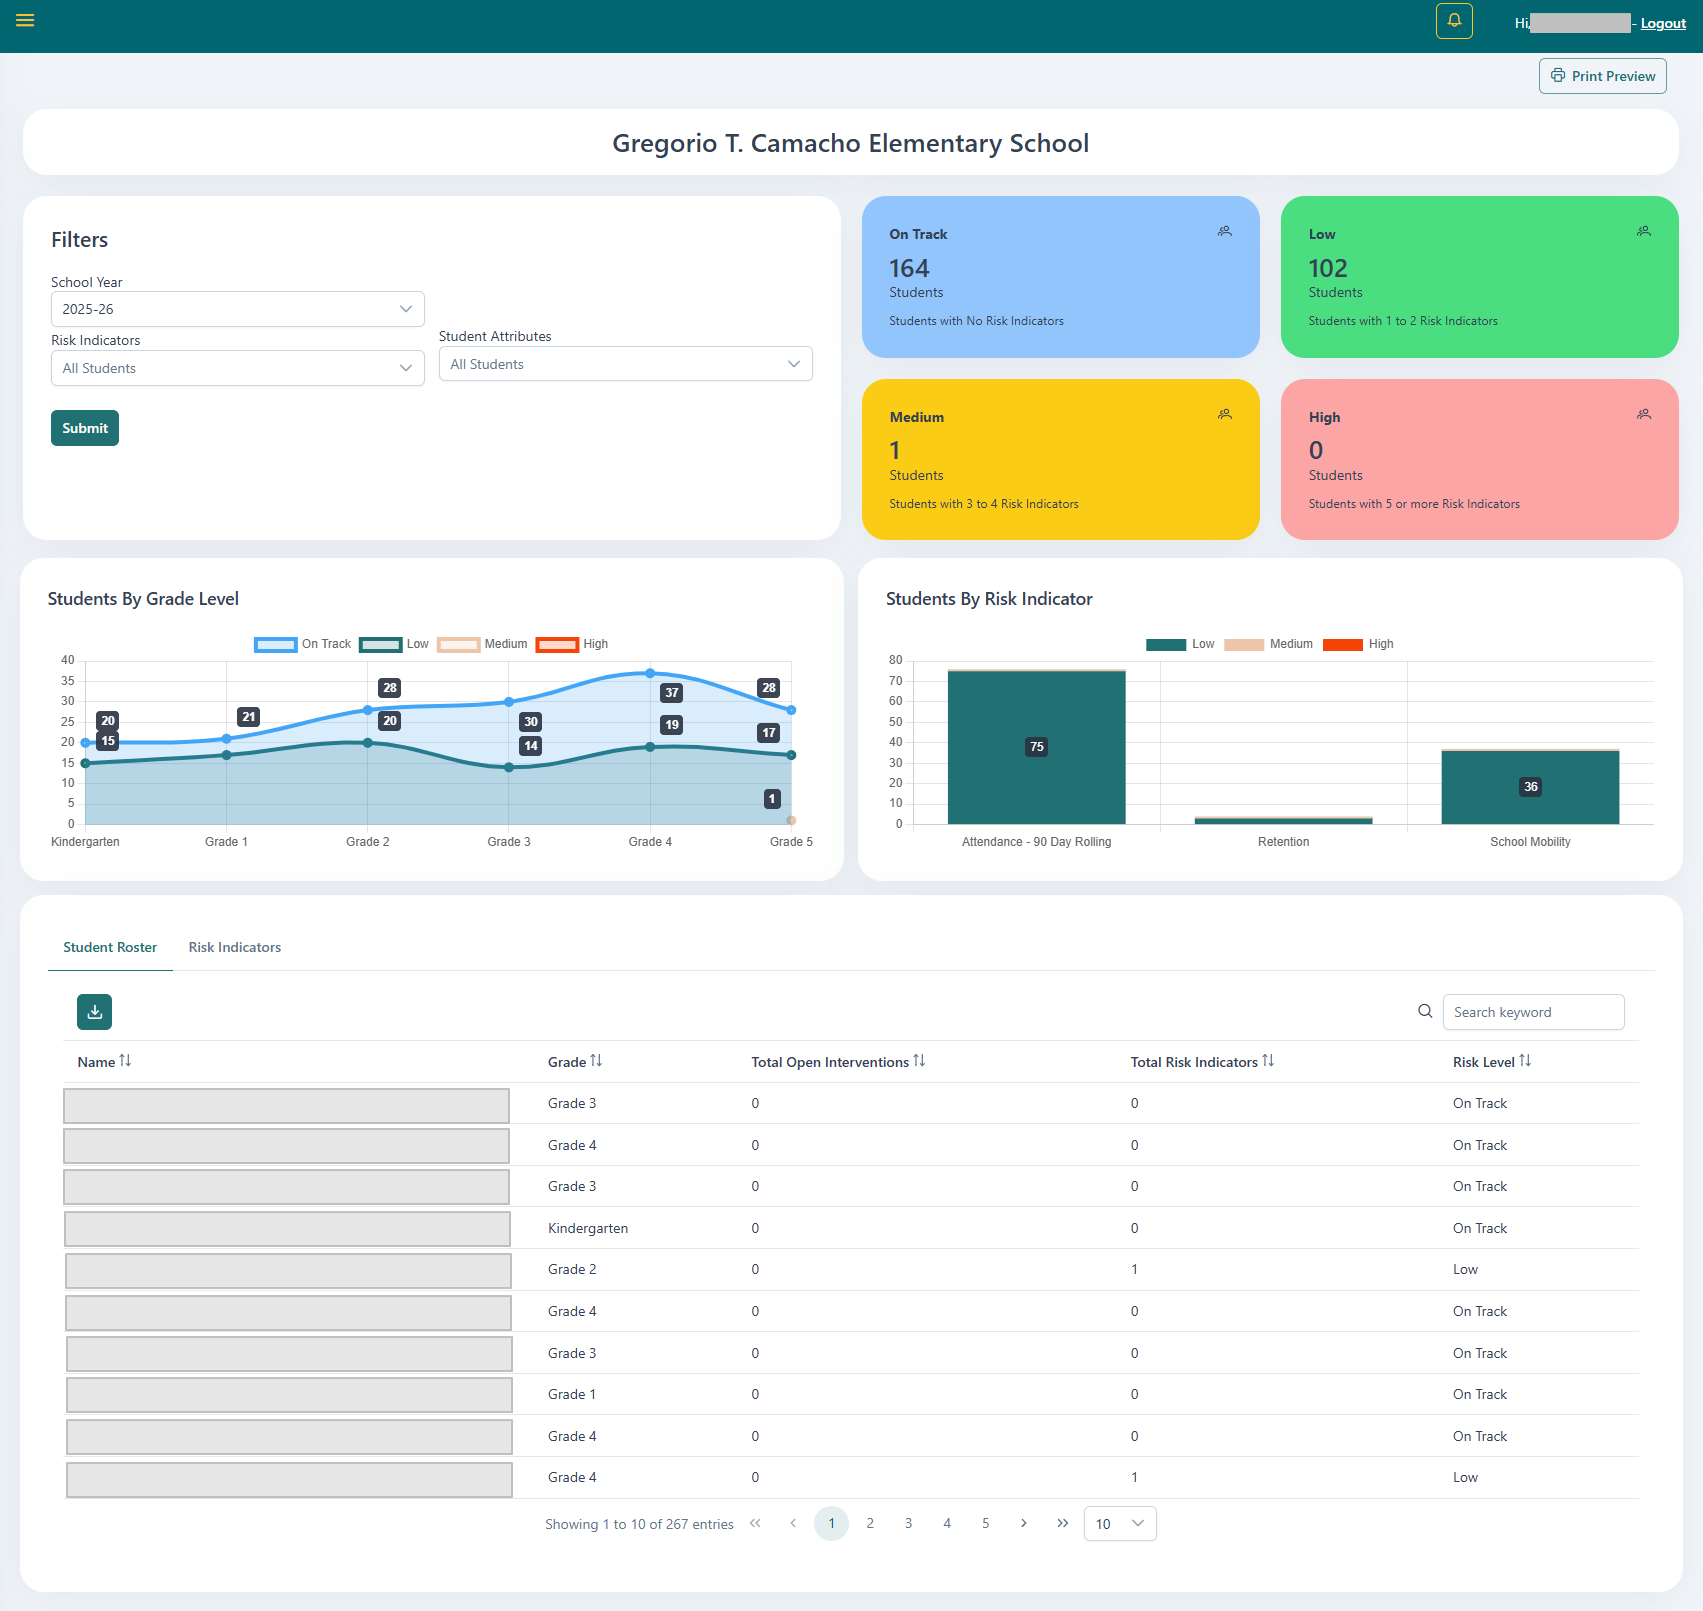
Tables
The School Dashboard also includes the Student Roster and Risk Indicators tables. For more information on these tables visit here