District Dashboard
The district dashboard provides a high-level perspective of EWS indicators organized for viewing and analysis by District personnel. The page includes analytics to compare and contrast CNMI PSS Schools.
Visuals
The visuals displayed on this dashboard include:
| Visual | Description |
|---|---|
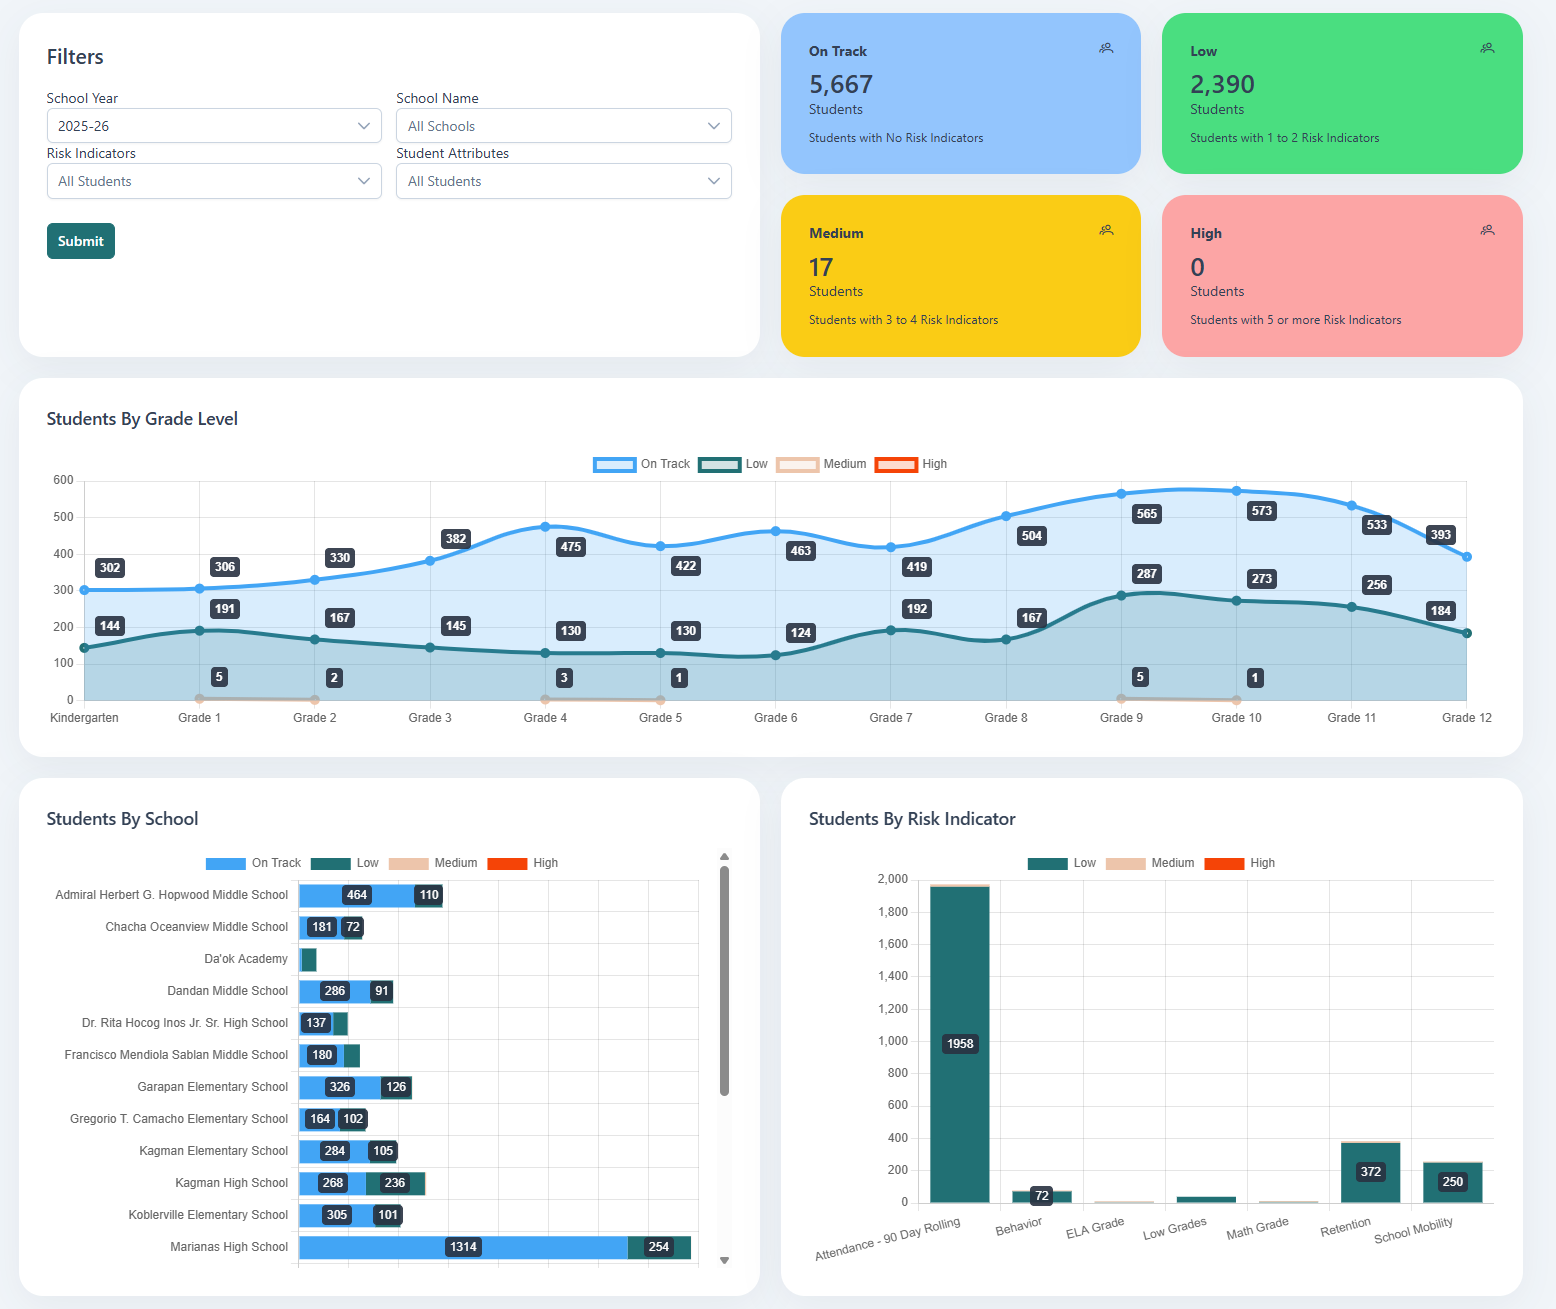
| Risk Level Student Count Cards | Displays the count of students and the business rule for each risk level |
| Students By Grade Level | A line graph that shows the count of students by risk level by grade |
| Students By School | A bar graph that shows the count of students by risk level by school |
| Students By Risk Indicator | A bar graph that shows the count of students by risk level by risk indicator |