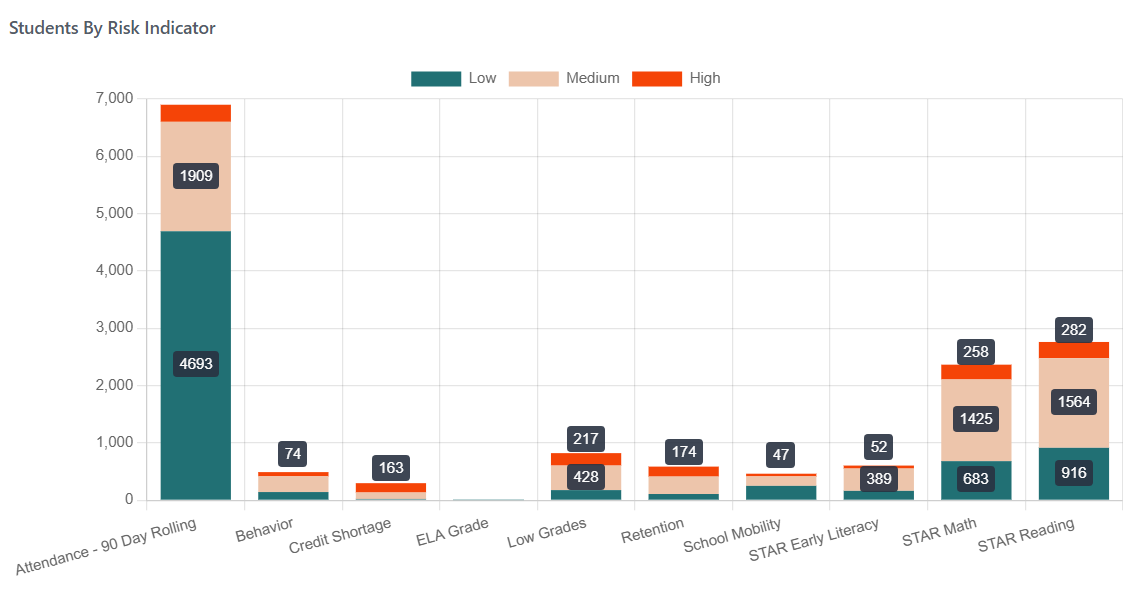
Charts
Each chart will show the count of students by their risk level per reporting point based on the applied filters.
Features
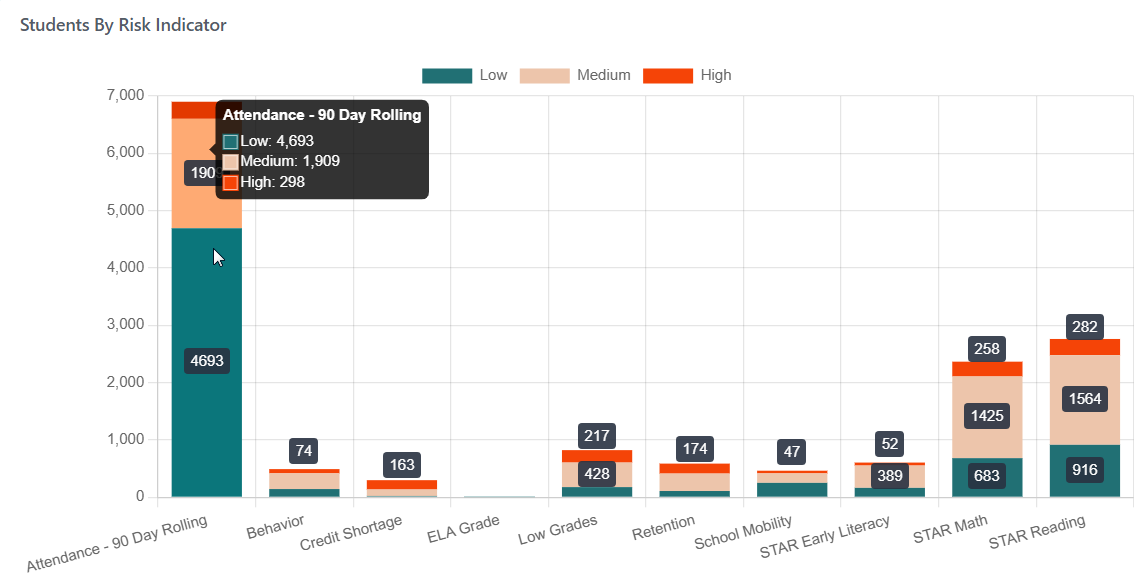
Tooltip Display
Hovering over the data points in each chart will show a tooltip with additional details on that data point.
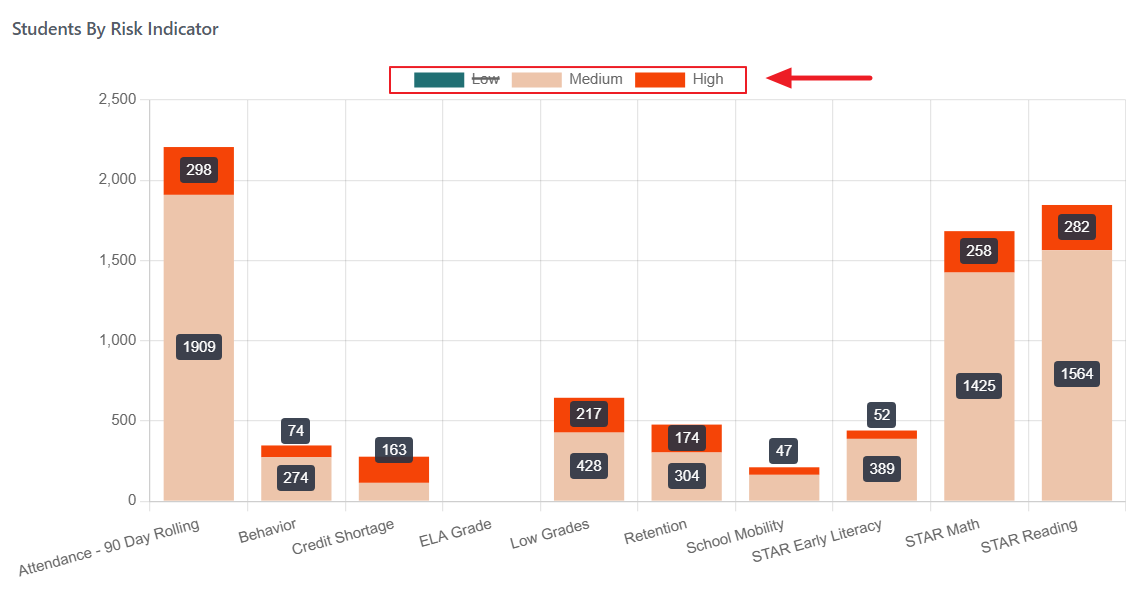
Focus Data Points
Single or multiple data points can be focused on a chart by removing selected points from the chart view. Clicking the data point name within the legend will show/hide the data point in the chart.